Typical meteor signals
The way in which a meteor reflects radio waves essentially depends on the density of free electrons in the trail. Generally, two limiting cases are discussed: that of very low electron densities, the underdense trails, and that of very high electron densities, the overdense trails. By extension, we will call meteors associated with underdense trails “underdense meteors,” and those associated with overdense trails “overdense meteors.”
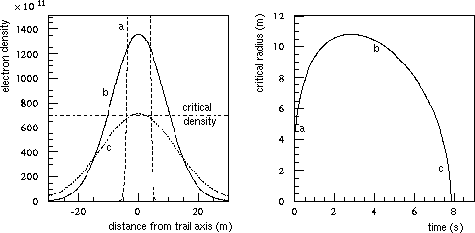
 Figure 1 – The distribution of ion density in a meteor trail. The plasma fequency, which is proportional to the ion density, shows the same distribution. The center of the trail, where the plasma frequency is higher than the used radio frequency, is a plasma.
The reflection on both kinds of trails is discussed in many papers(e.g. [13,26]), and will thus not be addressed in the current text. Here we will only mention the most important properties of the signals from both kinds of trails.
Underdense meteors
Underdense meteors of course correspond to faint meteors. Theory sets an upper limit on the line density for underdense reflection, approximately corresponding to 2×10¹⁴ electrons per meter. This is a line density generally associated with 5th magnitude meteors. Observations of underdense reflections cover a meteoroid mass range that is not observable with the naked eye.
The signal received from reflection on underdense trails is shown in Figure 2: a very steep rise of a few hundreds of a second is followed by an exponential decay of the received power. The evolution of the signal power with time is called the profile of the meteor. Signals from underdense meteors last no more than a few tenths of a second. Apart from the simplicity of the received power profile, underdense meteors have two other qualities in favor of a good reduction: they are very numerous (enabling the use of statistical reduction techniques) and they strictly obey the specularity rules. This last property creates a link between the position of the meteor reflection point in the sky and the meteor path in the atmosphere. This is especially useful in all kinds of techniques associated with the radio observation of meteor streams.
Overdense meteors
Overdense meteors are less numerous and correspond to brighter meteors. The reflections can last for seconds. During this relatively long period of time, the trail is often subject to severe distortions by wind. This can make an overdense trail eventually reflect radio waves to the receiver site, even if it was not initially suitably oriented for specular reflection. Furthermore, it makes that the evolution of the signal power is mostly unpredictable and often highly irregular. A reliable reduction of overdense meteor observations is therefore difficult. Figure 3 shows a typical observation of such a reflection.
 Figure 3 – A typical overdense meteor, observed by the RAMSES setup. The strong oscillations (deep fading) are a consequence of the interference between signals reflected on different parts of the trail, when it has been distorted by wind.
In the sequel, we will only consider underdense meteors for determining the parameters of the meteor astronomy set-ups, since overdense trails are better reflectors for radio waves. When analyzing the limits of a meteor system, the faintest observable meteor will have to be looked for, and this will be an underdense meteor for every reasonable set-up.
Diffusion of the trail
Immediately after the trail is formed, the ions start diffusing in the surrounding atmosphere. At any time, the ion density distribution can be considered to be Gaussian.
By diffusing, the overdense part of the trail grows, while the maximal ion density decreases. Eventually, this decrease causes the radius of the overdense part of the trail to diminish, until no overdense part remains. This evolution is illustrated in Figure 4. As the power of the received signal is proportional to the radius of the trail, the signal strength due to the reflection on the overdense part of the trail first increases, then decreases and finally abruptly disappears when no overdense part is left. At that time, only an underdense trail remains.
 Figure 4 – The change in radius of the overdense trail part due to the radius. As the trail diffuses, first the radius grows (from a to b), then it decreases (from b to c).
When the trail is underdense, i.e., when produced by a small meteoroid or when it is the remainder of an overdense trail, reflection is accomplished by individual scattering of the radio wave by the electrons in the trail. As the trail diffuses, loss in coherence of the scattered waves causes rapid signal decrease. The decrease of the signal power is exponential. The time constant of the exponential depends on the diffusion speed, which is essentially a function of atmospheric density.
Fresnel oscillations
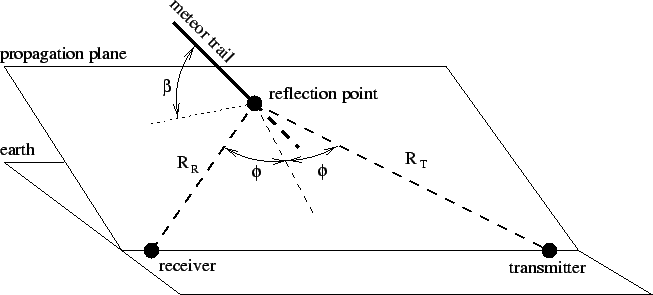
Specular reflection can be explained by wave interference. Radio waves are in fact scattered from all parts of a meteor trail, but constructive interference only occurs in given directions, along the paths considered in geometrical optics. The closer a point of the trail is to the geometrical reflection point, the more it influences the final signal. In practical situations, a few kilometers of the meteor trail effectively contribute to the signal. Although it is more appropriate to talk of a reflecting section than of a reflection point, the latter term is often used because of the handy parallel with geometrical optics.
We can have a closer look at the reflection process. Looking at Figure 5a, it is clear that a signal reflecting from point q travels a longer distance than a signal reflecting from point p. Therefore there will be a difference in phase between both signals. One can define zones of constructive interference with the “main signal” (the signal via p, the reflection point predicted by geometrical optics), and zones of destructive interference. They are colored white and black, respectively, in Figure 5a. These zones are called the Fresnel zones.
During a meteoroid’s flight, alternately “white” and “black” parts of the trail are formed, leading to signal strengthening and signal weakening by interference. The received power from a forming meteor trail thus evolves like shown in Figure 5b.
The signal from a meteor typically takes less than a tenth of a second to rise to maximal power. In order to record Fresnel oscillations, sample rates of several hundreds of measurements per second are needed.
Note that when the size of the Fresnel zones is known, the velocity of the meteoroid can be found by measuring the frequency of the oscillations shown in Figure 5b. The calculation of the size of the Fresnel zones is possible when the full reflection geometry is known.
Received power
The maximal received power P(0) from an underdense meteor is approximately given by:

The above equation will be useful when estimating the performance of a set-up. It is however a little too crude to use in the astronomical reduction of the observations, as it does not take into account all physical aspects of the problem.
Wind shear
In the upper atmosphere, strong winds distort the meteor trail, thus “breaking” the “meteor mirror”. As a consequence, multiple reflection points can appear on the trail (think of the light bulb seen in a broken mirror). Radio waves from different reflection points interfere. As the reflection points are not stationary due to the wind, fast oscillations are observed in the received signal power. This feature can only be observed in meteors after a few seconds. Consequently, it does not affect underdense meteors, as these rarely last more than a few tenths of a second. The usual frequency of the oscillations is 5 to 10 Hz. These oscillations are sometimes called “deep fading”.
Doppler shift
Meteor trails often drift due to high altitude winds, which causes a Doppler shift of the reflected signal. This effect is sometimes severely enhanced by the tilting of the trail due to wind: the reflection point then “slides” on the trail, resulting in a much higher Doppler shift.
Trail drifting velocities go up to 100 m/s. This corresponds to a frequency shift of about 30 Hz at 40 MHz. The tilting of the trail has more severe effects. Observations with a backscatter set-up [15] show the reflection point sometimes slides over the trail at velocities of several kilometers per second. The observations also show a strong tendency for meteors with short durations to have higher Doppler shifts than longer duration meteors.
It can be expected that the sliding effect will still be greater for forward scatter set-ups, as small changes in the orientation of the trail can have a larger effect on the position of the reflection point than in the backscatter case. A rough estimation based on the comparison of the curvature radius of the forward scatter reflection ellipsoid (see [26]) and that of the backscatter reflection sphere shows that forward scattering can amplify the sliding effect by a factor 10. Considering all this, Doppler shifts up to 15 kHz are theoretically possible at 40 MHz.
Note that very bright meteors sometimes show a “head echo.” This occurs when the radio waves reflect on the plasma cloud surrounding the meteoroid entering the atmosphere. As this plasma cloud is moving with the velocity of the meteoroid, it creates a short duration, strongly varying Doppler shift during the creation of the trail.
Received spectrum
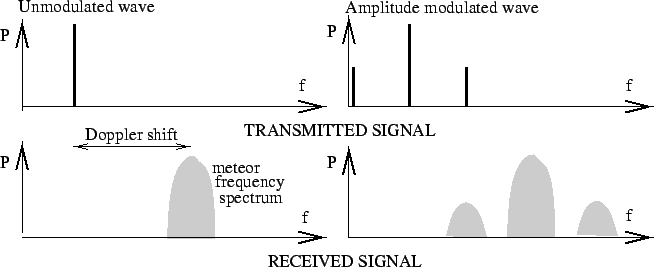
Besides being Doppler-shifted, the scattered signal is also amplitude modulated by the varying reflectivity of the meteor trail (signal rise, Fresnel oscillations, deep fading, exponential decay, …). As amplitude modulations create side bands in the spectrum, the transmitted spectrum will be distorted by the reflection. This is shown in Figure 8.
 Figure 8 – Meteor reflections from a given stream will appear only in a strip in the sky as seen from the receiver site. This figure is an example calculated by Project Meteor, a program by Paul Vauterin. It shows where the Perseids are to appear for the meteor set-up in Ghent, Belgium, at 13h UT on August 12.
How large will the broadening of the spectral components be? This depends on the amplitude variations that are present in the signal: the faster the scattered amplitude varies, the greater the blurring of the spectrum.
The broadening can be predicted by calculating the Fourier expansion of the amplitude variation of the signal. The maximal frequency in this expansion determines the width of the reflected spectral line. The fastest significant amplitude variations in a meteor signal are the initial power rise and the Fresnel oscillations. The minimal build-up time is in the order of 10 milliseconds, while Fresnel oscillations have a maximal frequency of about 200 Hz. The total width of the reflected spectral line should thus not exceed 400 Hz.
Polarization
As the ionosphere (i.e., the D- and E-layers) and meteor trails are plasmas in a magnetic field (the Earth magnetic field), Faraday rotation of the incoming radio wave can occur, i.e., the polarization plane of the wave can rotate on its way to the receiver.
In the case of underdense meteors, the resonance effect can influence the polarization of the reflected wave too. In the beginning of trail diffusion, there is a moment where a resonance effect occurs in the reflection of radio waves with an electric vector perpendicular to the trail direction. This effect temporarily enhances (up to a factor 2) the reflection coefficient of the trail for the perpendicular component of the incoming wave, influencing the polarization of the resulting reflected wave.
Due to the Faraday and resonance effects, the rotation of the polarization plane is thus possible. This effect will be more important at lower frequencies.
Interferences
All kinds of natural and man-made radio sources emit radio waves at various frequencies. Generally, we are interested in the radio signals of one particular source. Signals from other sources are considered as interference.
Interference from other transmitters
When tuning a receiver to a given transmitter, it is possible another transmitter at the same or a nearby frequency contributes to the signal too. Eliminating this contribution is generally not possible. However, if, through a meteor reflection, one or the other receiver is heard, in some cases one can try to discriminate between the transmitter with the help of the signal contents (RDS, pitch of the modulation, …). The best solution is to find a frequency with only one transmitter, of course.
Note that not only meteors can reflect radio waves: planes are known to yield echoes too. The evolution of the received amplitude with time is very different of that in the case of meteors. Therefore, these signals can be discriminated against while processing the observations.
Transmitters at other frequencies can also yield a signal, if the tuning frequency of the receiver is two or three times that of the transmitter. These “harmonics” originate in the receiver system or radiate from the transmitter, and are only observed with very powerful transmitters.
Another way transmitters at other frequencies can produce a signal, is when one or several transmitters are strong enough to overload the receiver front end and mix with each other, producing a huge amount of mixing products, thus creating signals at a multitude of frequencies. A selective antenna or a band pass filter can eliminate this interference.
Broad-band interference
Whenever there is a spark in an electrical device, radio waves are emitted. The frequency of these radio waves range from kHz to GHz. The distance at which these radio waves can be received strongly depends on the strength of the spark, the shielding of the device, the position of the device in the antenna radiation pattern, … Experiences at the Urania Observatory have shown that the switching of lights can be observed over distances of tens of meters, and trains over distances of more than 100 meters. A single spark creates a spike of a few milliseconds in the signal. Often series of sparks are produced, resulting in a sort of “grass” on the signal. Devices know to produce interference are for instance switches (one spike), TL lamps (some tens of spikes in about one second), engines of scooters and trains (continuous grass), …
Natural broad-band interference also exists. Lightning, for instance, is known to produce strong broad-band radio interference. Signals from lightning consist of a series of spikes at almost equal intervals.
The elimination of broad-band interference can be done by taking a second receiver tuned at a slightly different frequency. The signals from transmitters will be different on both receivers, while the broad-band interference will show up to be the same. The comparison between both signals can best be done with a computer. Such an automated setup is in operation at the university of Ghent: the ProMeteoS setup.
Interference from oscillators
Modern electronic devices often have microprocessors. The working of these microprocessors is based on a clock (oscillator). These systems emit radio waves at the frequency and multiples of the frequency of the clock. You can take some precautions when choosing your hardware. For instance, if you plan observations on 66 MHz, it is safe not to use computers with processor frequencies of 33 MHz or 66 MHz.
Most electronic devices (including computers) contain several oscillators at different frequencies, yielding a complex spectrum of radio emission. If your devices are not shielded well, there might be interference at unexpected frequencies.


